Mapping Wearable Sensor Inputs to Refine Prop Bet Accuracy Across Professional Athletic Events
Dana Ludwig · Jun 7, 2026
Mapping Wearable Sensor Inputs to Refine Prop Bet Accuracy Across Professional Athletic Events
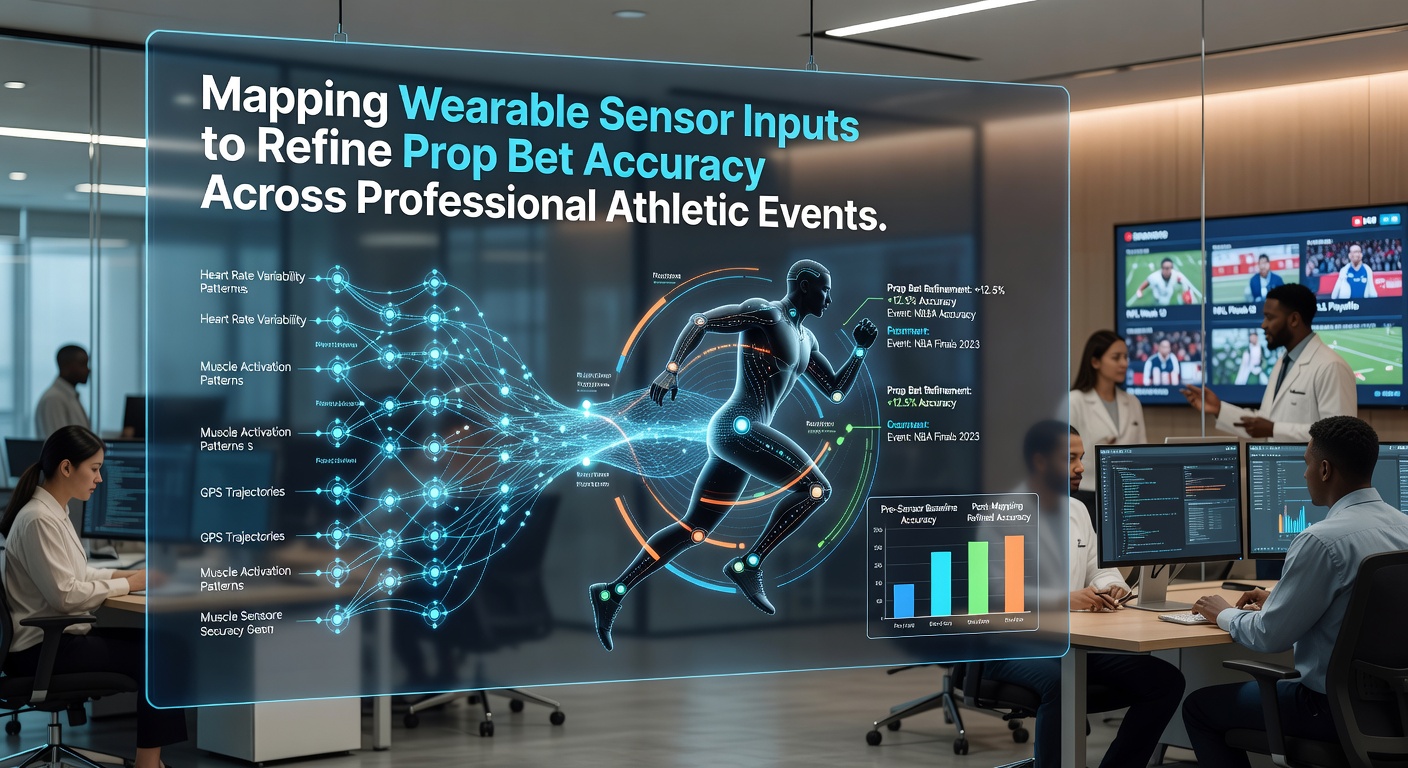
Professional sports leagues have expanded their use of wearable devices to capture detailed physiological and movement data from athletes, and betting markets now incorporate these inputs when pricing proposition wagers on individual performances. Sensor arrays track metrics such as acceleration, heart rate variability, and joint load, then feed the information into models that adjust probabilities for outcomes like total yards gained or points scored in a single contest.How Sensor Data Enters Prop Betting Models
Teams across the NFL, NBA, and Major League Baseball outfit players with GPS-enabled vests and biometric straps that record positional data at high frequency, while similar systems appear in European soccer and Australian rules football. Analysts convert raw streams into derived statistics that correlate with historical betting results, allowing oddsmakers to refine lines on props such as a quarterback’s completion percentage or a forward’s expected goal contribution. The process begins with calibration against known performance baselines, after which algorithms identify deviations that influence short-term projections rather than season-long aggregates.
Operators receive anonymized aggregates from league-approved data partners, then merge those figures with public box scores and video tracking to create layered forecasts. In June 2026 several North American sportsbooks reported tighter margins on player prop markets after incorporating load-management signals from training sessions, because early detection of elevated muscle stress often precedes reduced output in subsequent games.
Technical Mapping Techniques
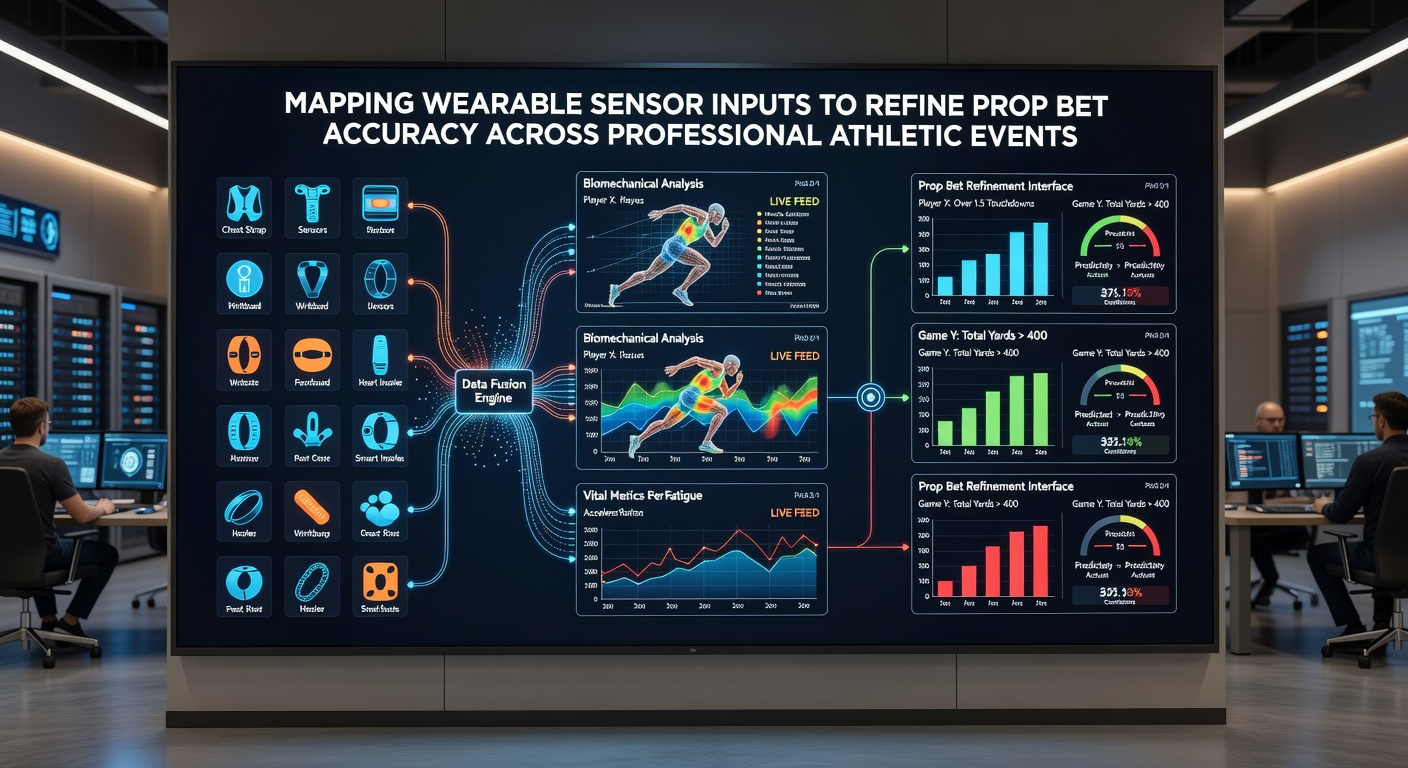
Engineers apply supervised learning frameworks that treat sensor readings as independent variables and realized prop results as dependent variables. For example, a model might link stride frequency captured during warm-ups to a running back’s yards-per-carry distribution, then output updated probabilities that shift the offered line by fractions of a point. Validation occurs through rolling cross-validation on prior seasons, ensuring that sensor-derived adjustments improve accuracy metrics such as Brier scores or log-loss compared with models that rely solely on traditional statistics.
Multiple leagues have standardized data formats through joint technical committees, which reduces latency when feeds move from locker-room tablets to centralized betting platforms. This standardization also allows smaller operators to access the same core inputs without building proprietary hardware partnerships.
Applications in Specific Leagues
Baseball organizations supply pitch-release data collected from sleeve sensors that measure elbow torque and spin rate, metrics that correlate with strikeout rates and earned-run averages in single-game props. Basketball teams share court-time load indexes derived from accelerometer readings, helping adjust over-under lines on minutes played or points scored when recovery windows shrink between back-to-back contests. Soccer clubs in major European leagues publish high-speed running distances from match-day kits, which oddsmakers combine with weather and pitch-condition variables to refine anytime-goalscorer probabilities.
These mappings remain subject to league rules that limit the granularity of data released to external parties, yet the trend toward greater transparency continues because clubs recognize that consistent, verified statistics support both injury-prevention programs and betting-market integrity.
Regulatory and Privacy Considerations
State gaming commissions in the United States and provincial regulators in Canada require operators to document the provenance of any non-public data used in odds compilation. The National Council of Sports Analytics has issued voluntary guidelines that encourage separation between performance-optimization data and betting-specific feeds, thereby reducing conflicts of interest. Academic researchers at institutions such as the University of Queensland have published peer-reviewed analyses showing that sensor-derived fatigue indicators improve prop accuracy by measurable margins when models control for schedule density and travel distance.
Challenges in Implementation
Device calibration drift, differences in sensor placement across teams, and varying sampling rates introduce noise that must be filtered before inputs reach pricing engines. Leagues also impose blackout periods on certain biometric streams during playoff windows, forcing oddsmakers to revert to public statistics alone for those contests. Despite these constraints, the overall trajectory points toward denser integration because the marginal improvement in forecast precision justifies continued investment by both sports organizations and wagering platforms.
Conclusion
Mapping wearable sensor inputs to prop bet pricing represents a convergence of sports science and quantitative risk management that continues to evolve as device accuracy and data-sharing protocols mature. Observers note that the same datasets supporting injury reduction also sharpen market efficiency, provided regulatory frameworks keep pace with technological capability. Continued collaboration among leagues, device manufacturers, and betting operators will determine how quickly these refinements propagate across additional sports and geographies.